Venneuler
# install.packages("venneuler")

library(venneuler)
## Loading required package: rJavalibrary(rJava)
v <- venneuler(c(A=450, B=1800, "A&B"=239))
plot(v)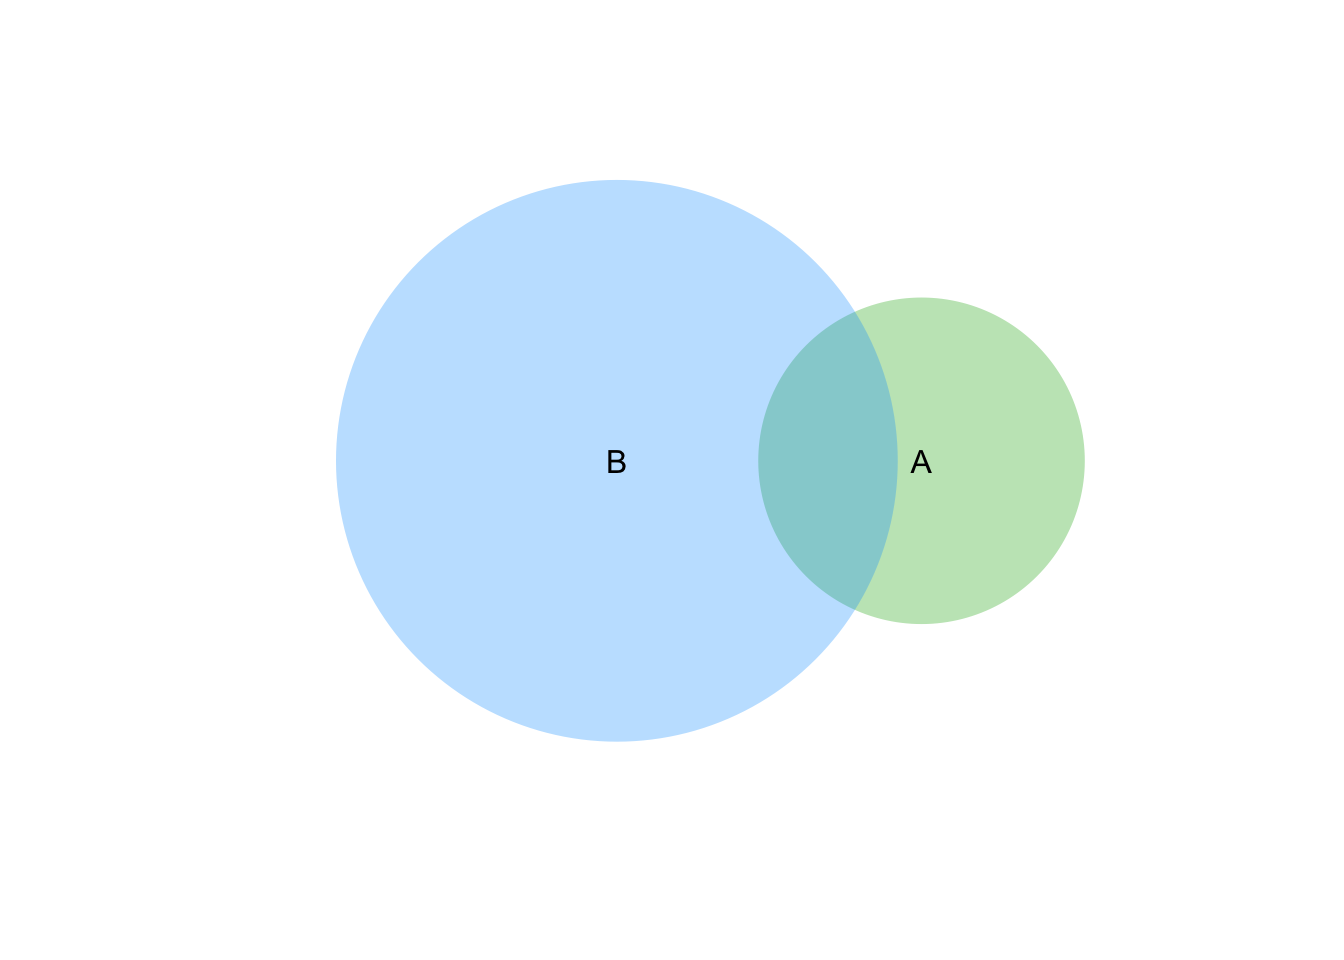
Another example
# TUTORIAL: Plotting Venn diagram wiht VENNEULER and VENNDIAGRAM
# Updated 11.6.2016

##### VENNEULER ######
library(venneuler)
library(rJava)

# EXAMPLE: triple plot
v <- venneuler(c(A=450, B=1800, C=200, D=100, "A&B"=239))
plot(v)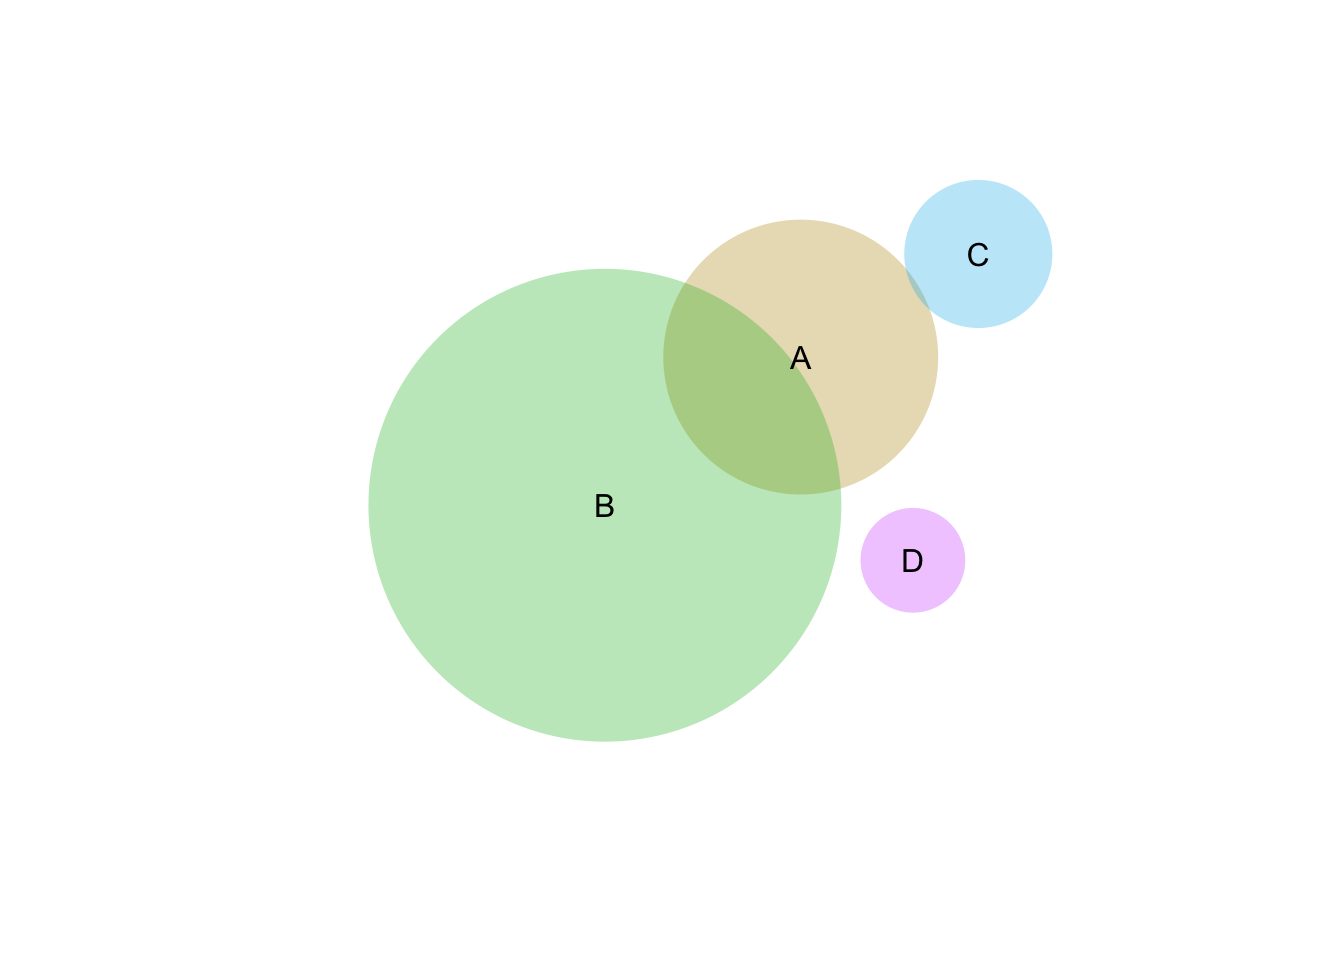
# Venndiagram of Three sets (Medicine Sectors)
# Saajat, miltä sektorilta saaneet reseptin
s <- venneuler(c(Julkinen=66 , Tyoterveys=27 , Yksityinen=27 ,
                 "Julkinen&Työterveys"=5,
                 "Julkinen&Yksityinen"=9,
                 "Työterveys&Yksityinen"=4,
                 "Julkinen&Työterveys&Yksityinen"=1 ))
plot(s)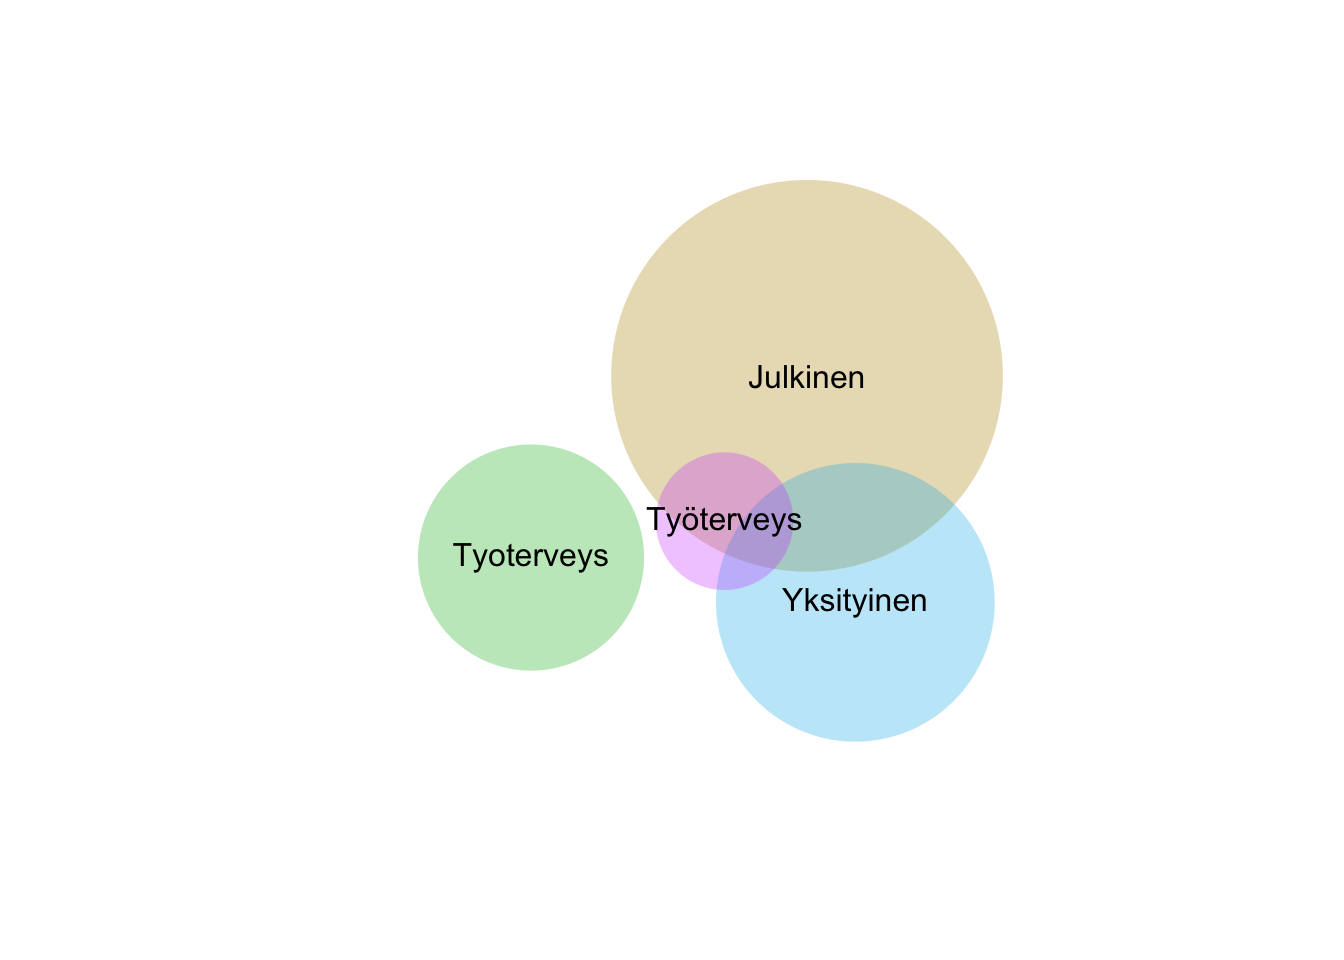
# Vennediagram of four sets
# People who got medicines
# Porprotional
s <- venneuler(c(Julkinen=43, Tyoterveys=20 , Yksityinen=18, Ei=35,
                 "Julkinen&Työterveys"=3,
                 "Julkinen&Yksityinen"=6,
                 "Työterveys&Yksityinen"=2,
                 "Julkinen&Työterveys&Yksityinen"=1 ))
plot(s)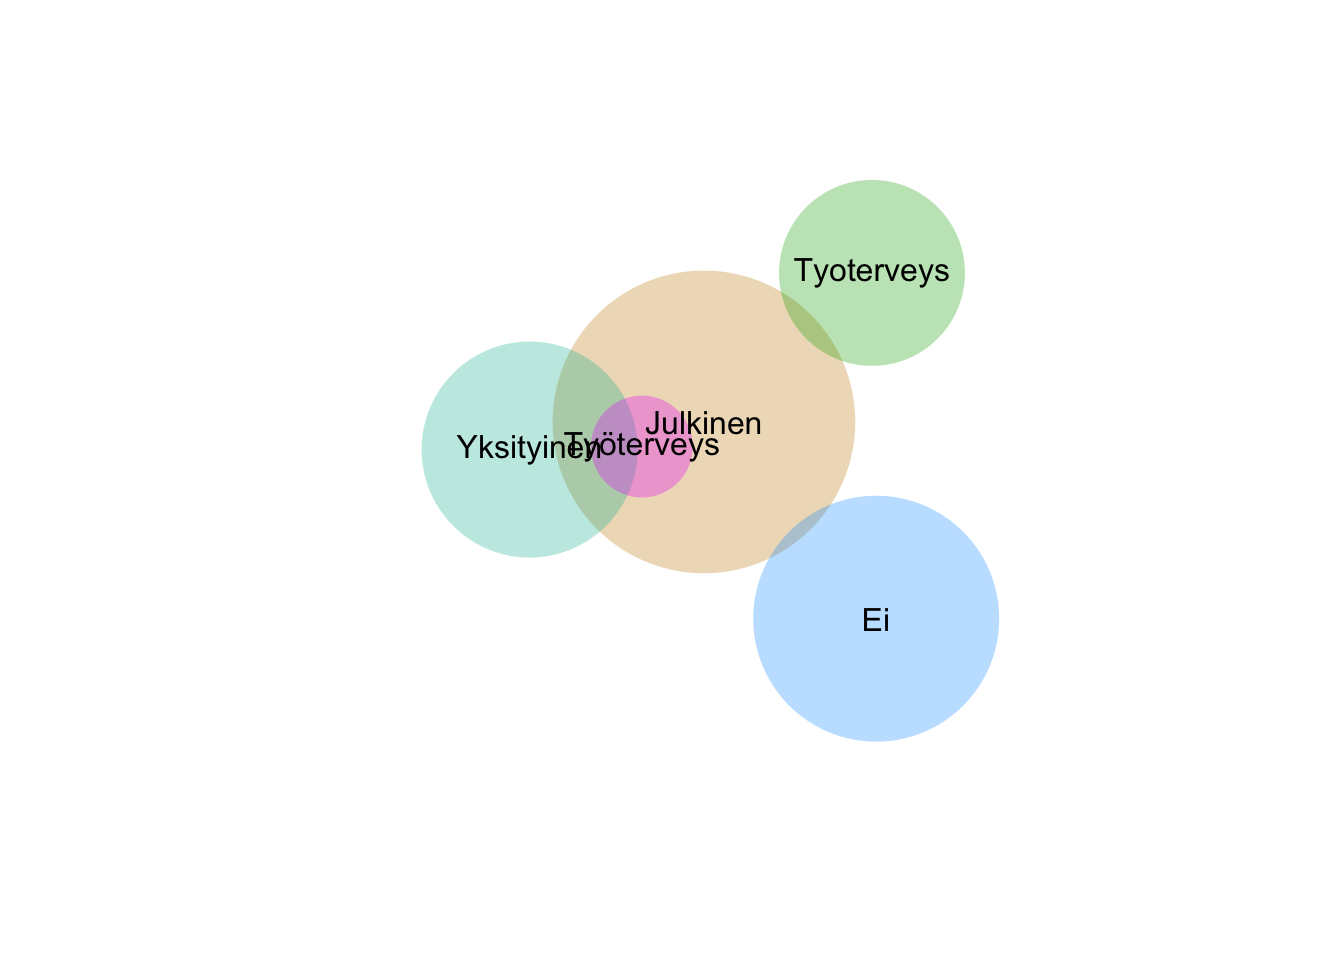
# Venndiagram of four sets
# People who got medicines
# Frequencys
s <- venneuler(c(Julkinen=87789, Tyoterveys=35320, Yksityinen=35954, Ei=69974,
                 "Julkinen&Työterveys"=6561,
                 "Julkinen&Yksityinen"=12144,
                 "Työterveys&Yksityinen"=4656,
                 "Julkinen&Työterveys&Yksityinen"=1778 ))
plot(s)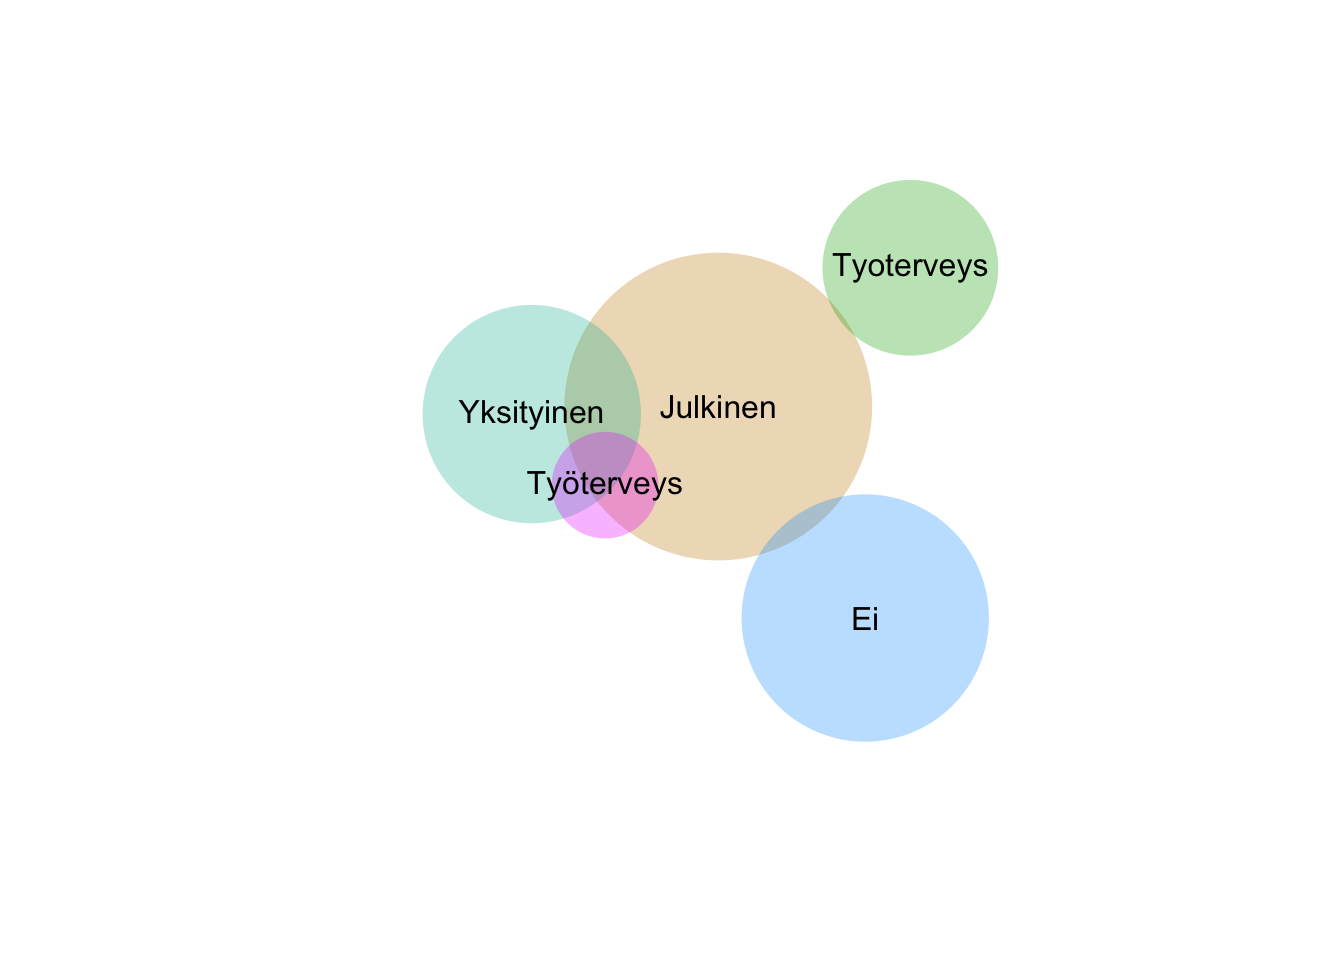
VennDiagram
##### VennDiagram #####
# https://cran.r-project.org/web/packages/VennDiagram/VennDiagram.pdf
# install.packages("VennDiagram")
library(VennDiagram)
## Loading required package: grid## Loading required package: futile.logger# EXAMPLE: A more complicated triple diagram
grid.newpage()
venn.plot <- draw.triple.venn(
area1 = 65,
area2 = 75,
area3 = 85,
n12 = 35,
n23 = 15,
n13 = 25,
n123 = 5,
category = c("First", "Second", "Third"),
fill = c("blue", "red", "green"),
# lty = "blank",
cex = 2,
cat.cex = 2,
cat.col = c("blue", "red", "green")
)
grid.draw(venn.plot)
# EXAMPLE: A simple two-set diagram
venn.plot <- draw.pairwise.venn(100, 70, 30, c("First", "Second"));
grid.draw(venn.plot);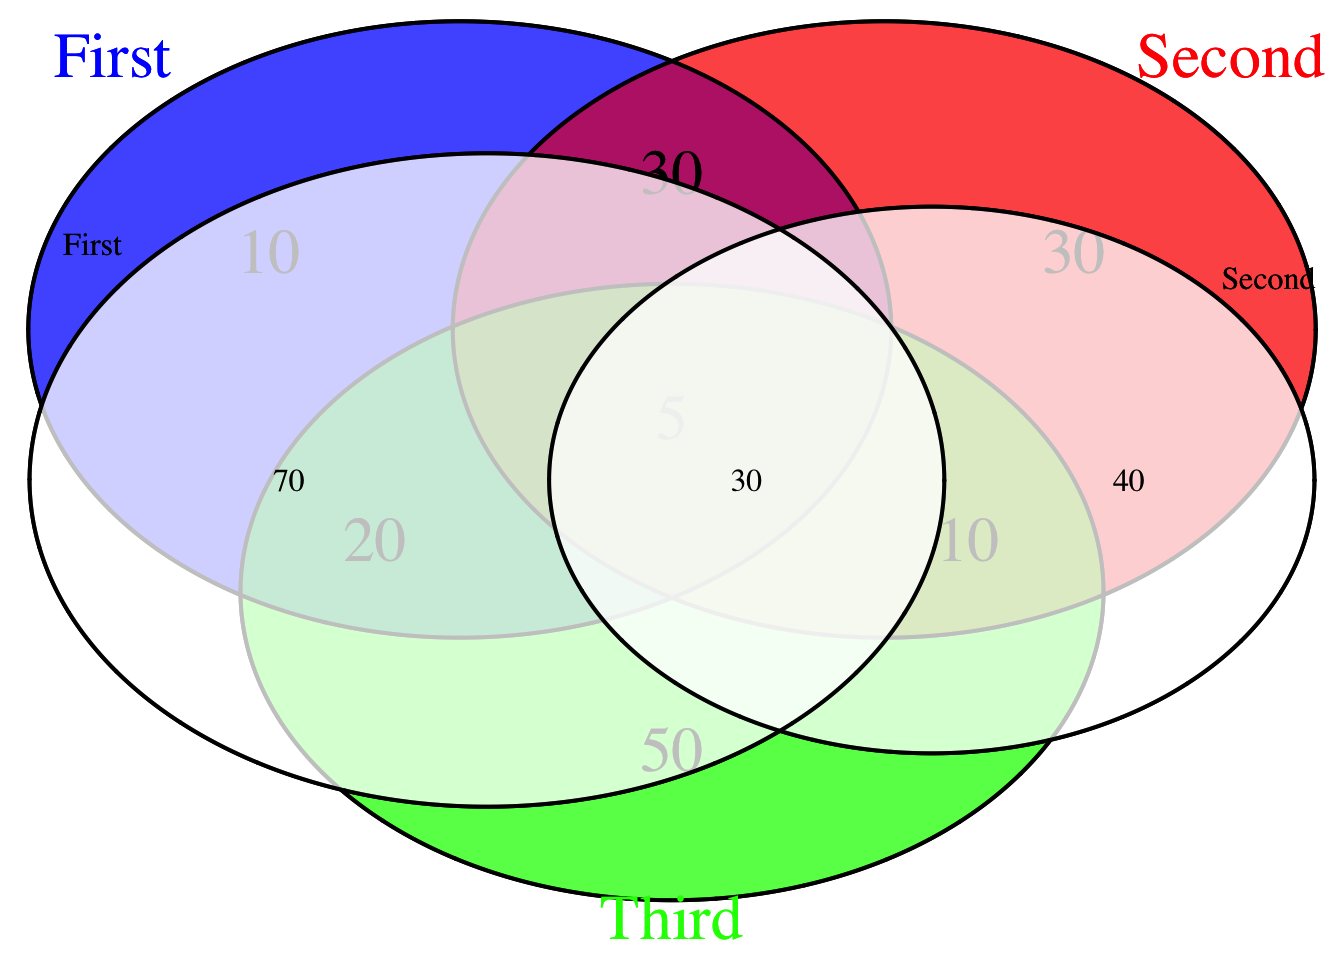
grid.newpage();

# EXAMPLE: Same diagram as above, but without scaling
venn.plot <- draw.pairwise.venn(100, 70, 30, c("First", "Second"), scaled = FALSE);
grid.draw(venn.plot);

# Draw two diagram using real data
venn.plot <- draw.pairwise.venn(66,27,5, c("Julkinen", "Tyoterveys"))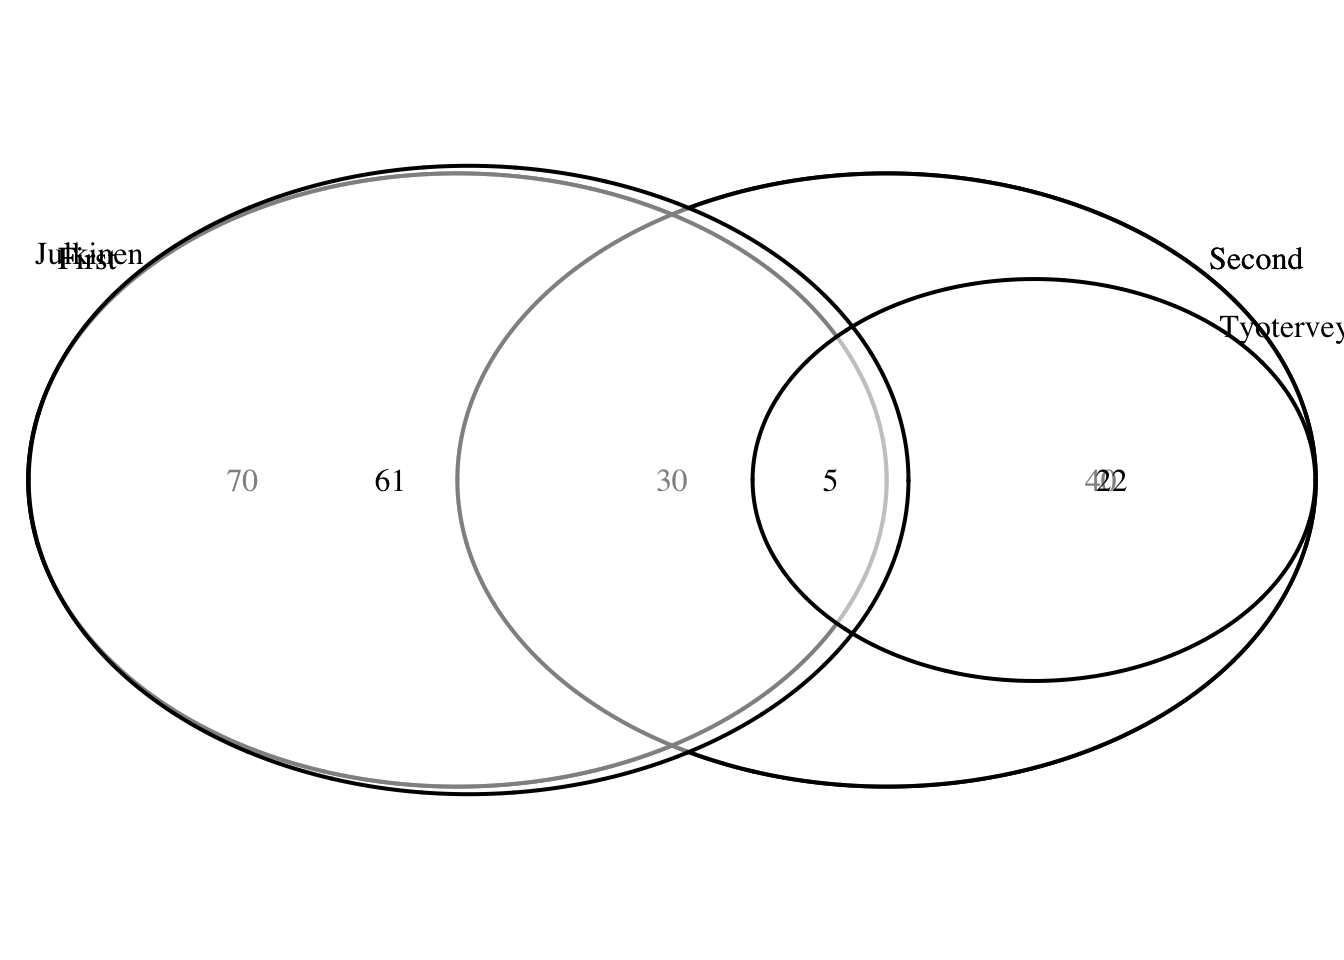
grid.newpage()
grid.draw(venn.plot)

# Venn plot of three sets, real data
venn.plot <- draw.triple.venn(66,27,27,5,4,9,1, c("Julkinen", "Tyoterveys", "Yksityinen"), scaled = TRUE);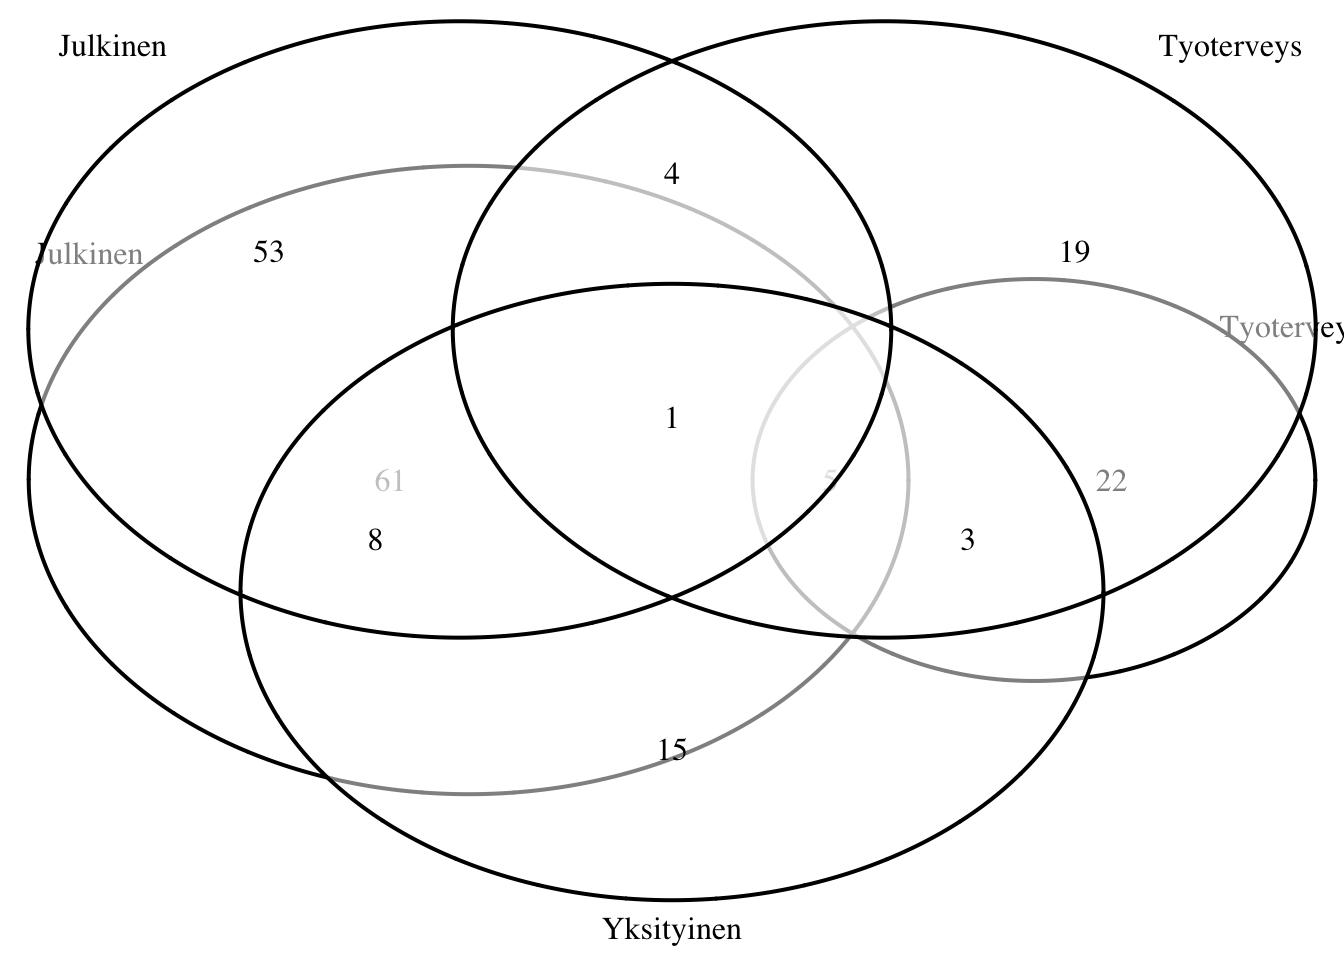
grid.newpage()
grid.draw(venn.plot)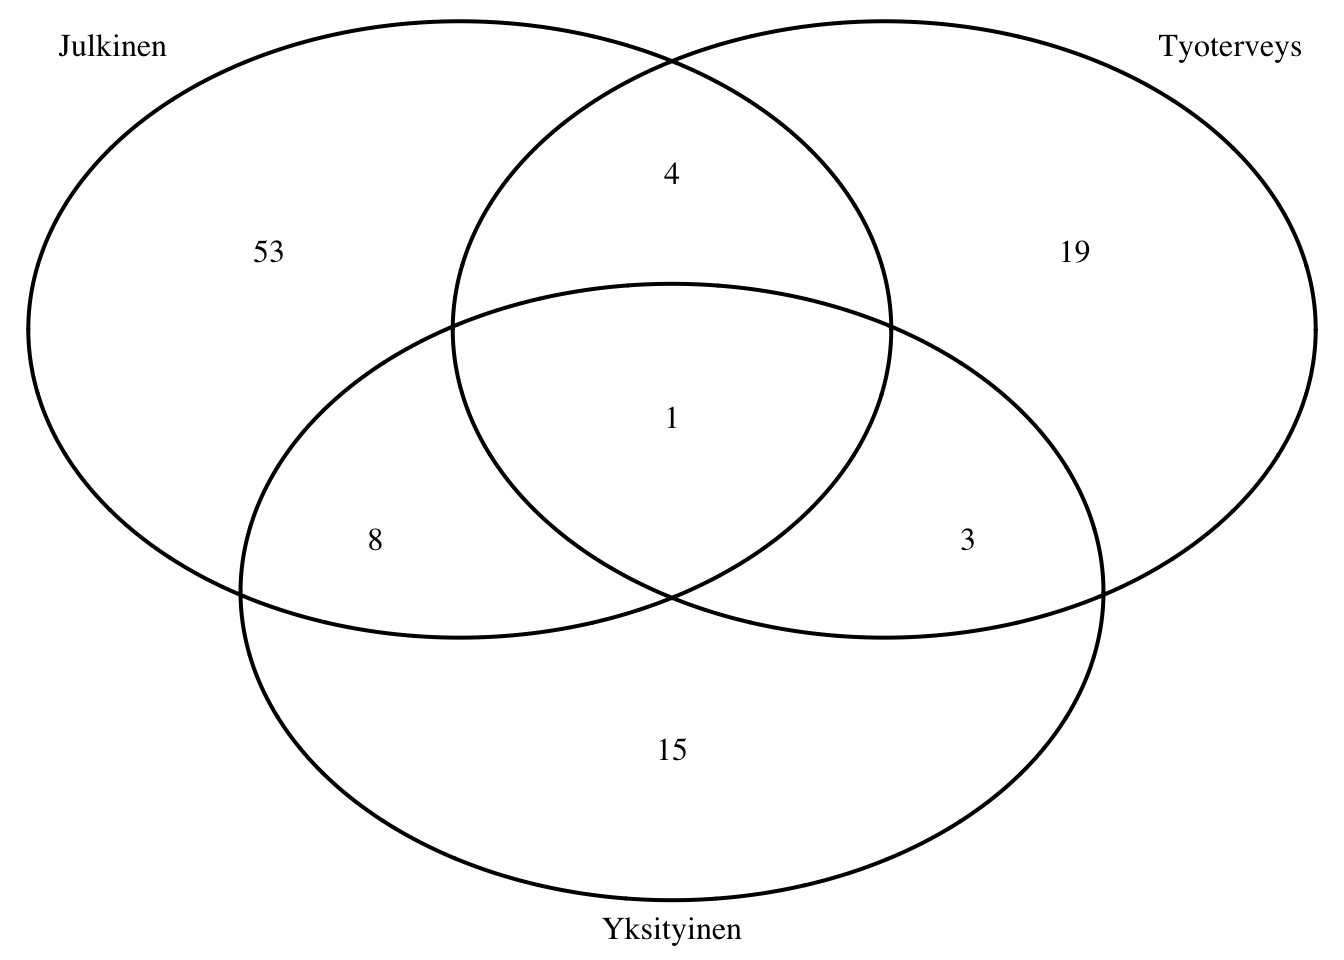
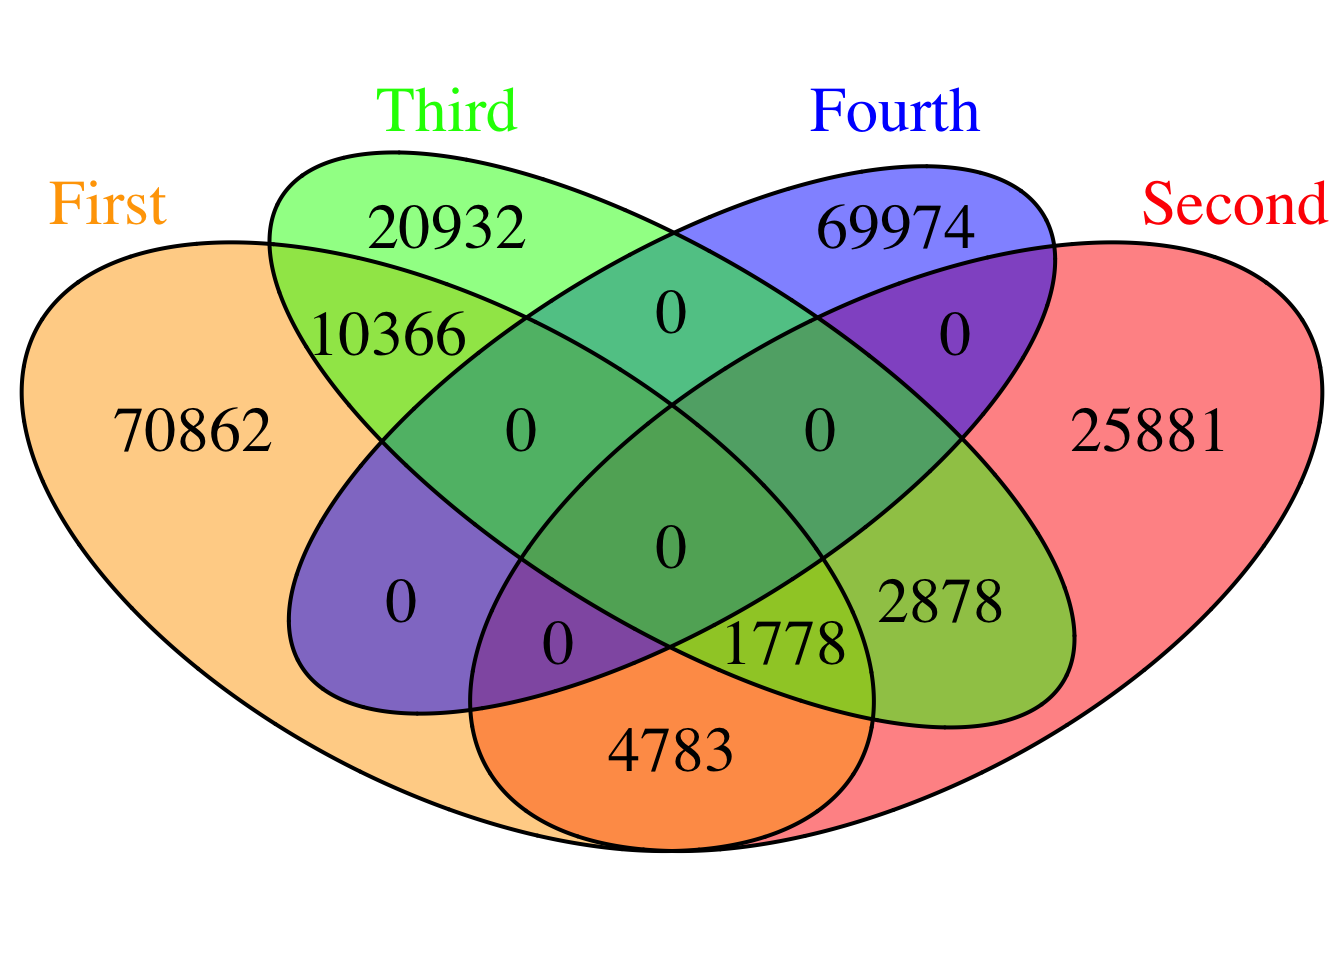
# Venn plot of four sets, real data
Ju=87789
Ty=35320
Yk=35954
Ei=69974
JuTy=6561
JuYk=12144
TyYk=4656
JuTyYk=1778
grid.newpage();
venn.plot <- draw.quad.venn(
  area1 = Ju,
  area2 = Ty,
  area3 = Yk,
  area4 = Ei,
  n12 = JuTy,
  n13 = JuYk,
  n14 = 0,
  n23 = TyYk,
  n24 = 0,
  n34 = 0,
  n123 = JuTyYk,
  n124 = 0,
  n134 = 0,
  n234 = 0,
  n1234 = 0,
  category = c("First", "Second", "Third", "Fourth"),
  fill = c("orange", "red", "green", "blue"),
  # lty = "dashed",
  cex = 2,
  cat.cex = 2,
  cat.col = c("orange", "red", "green", "blue")
)