Quick note of how to use wordcloud package
# install.packages("wordcloud")
library(wordcloud)
## Loading required package: RColorBrewer# Kevyt esimerkki
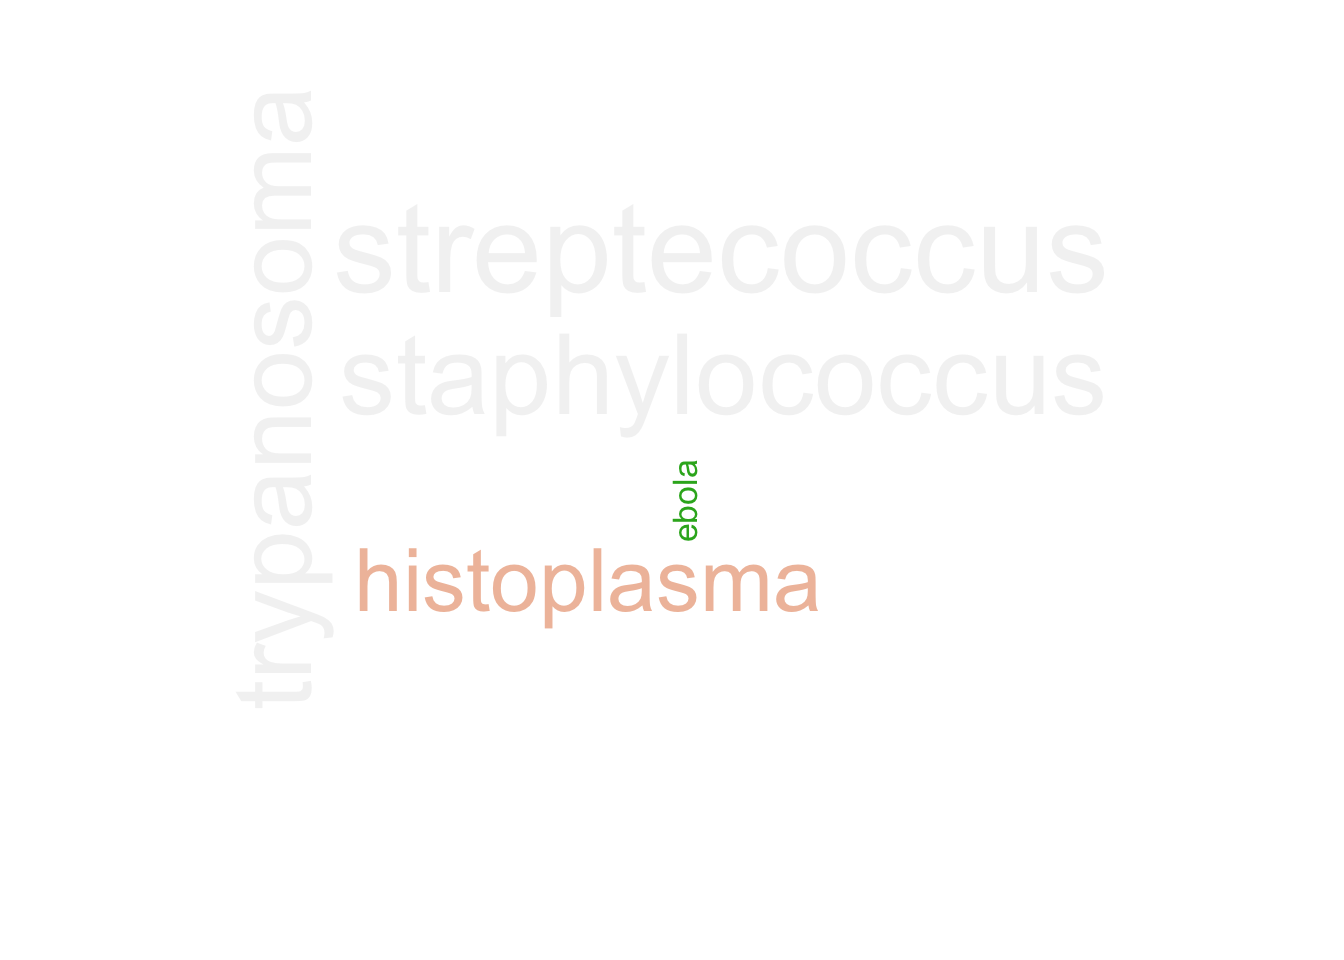
a = c("trypanosoma", "ebola", "staphylococcus", "streptecoccus", "histoplasma")
b = c( 0.3, 0.2, 0.9, 0.8, 0.6)
par(bg="black")
wordcloud(a,b, col=terrain.colors(length(a), alpha = .9), rot.per = .3)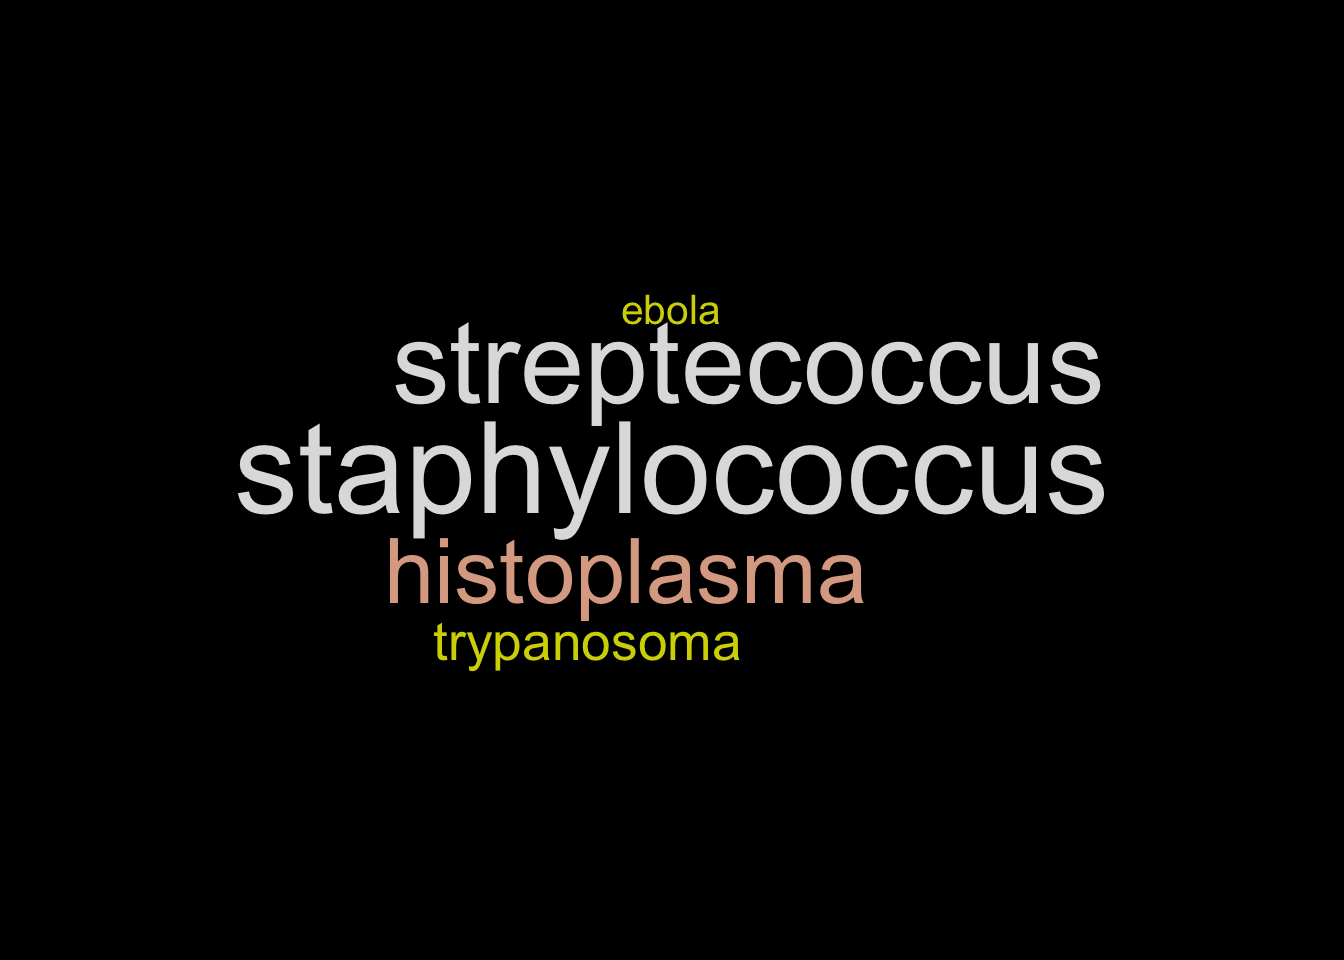
# Create a list of words
list_of_words <-  c("Open","Micro","Send it!","WhyR","Talk","Seminar","Talk",
    "Dataman","Python","Linux","Software","Graph","Social", "Resistance",
    "Publication","Analysis","Statistics","Science","Statistics","Data",
    "Programming","Local","Virus","Marker","Work","Fun","Home","RStudio", "CRAN",
    "Computing","Data-Science","Reproductible","GitHub","Coder")

# Frequencies
b <- sample(seq(0,1,0.02),
            length(list_of_words),
            replace=TRUE)

# The package will automatically make the wordcloud
wordcloud(words = a,
          freq = b,
          col = terrain.colors(length(a) ,
                             alpha=0.9) ,
          rot.per = 0.3 )