There are too many functionalities to quickly write about ggplot2, but these are what I’m mostly using and reusing.
To get into ggplot2, first thing to understand is that ggplot2 draws a plot by layers. A short motivation:
library(ggplot2)

p <- ggplot(data = mtcars, aes(x = hp, y = mpg))
p
p <- p + geom_point()
p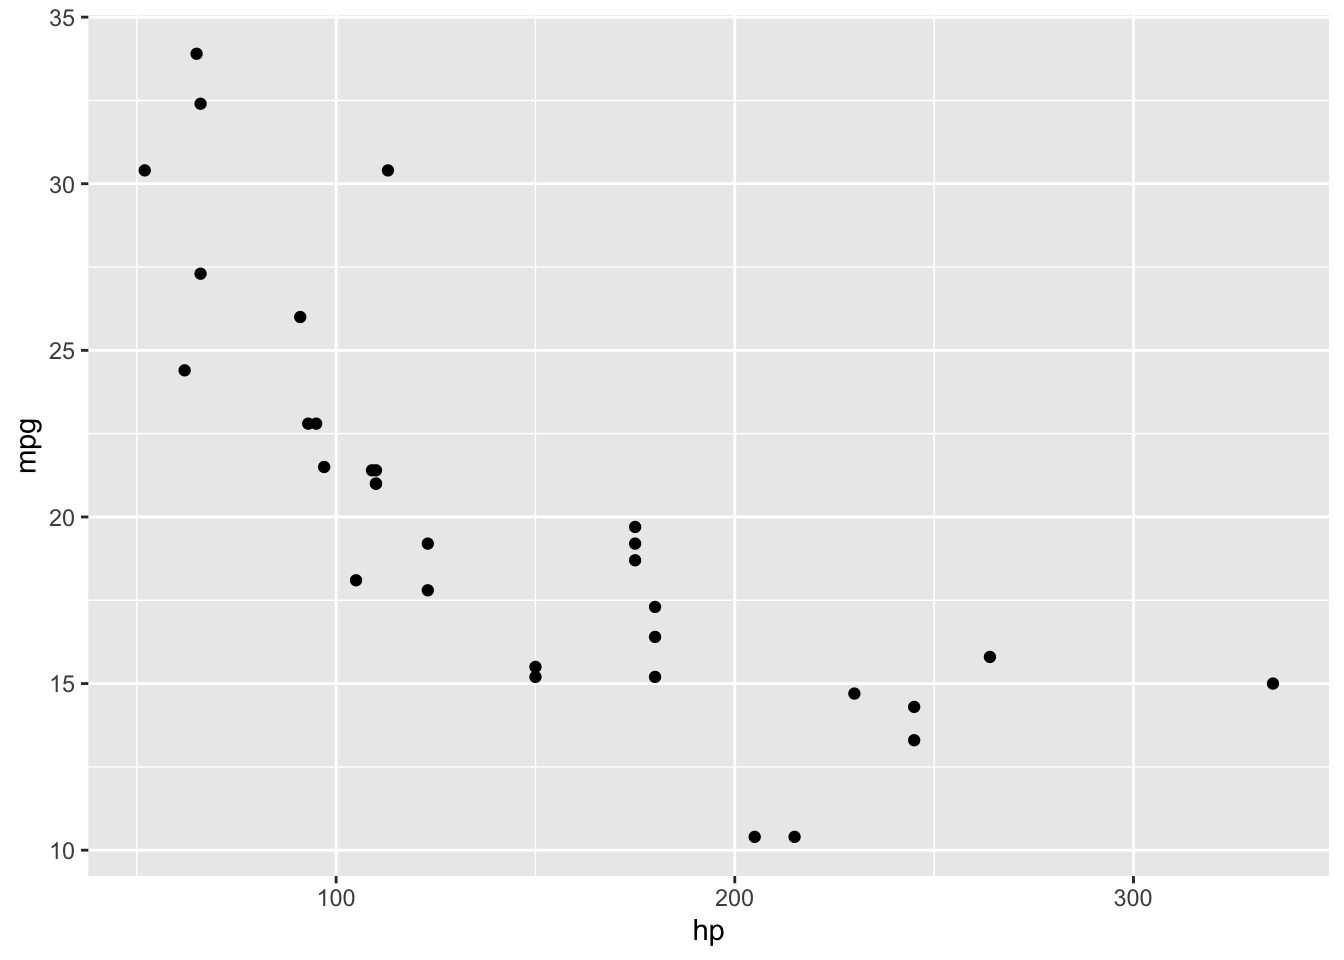
Another motivation
# Basic
g <- ggplot(data = mtcars, aes(x = hp, y = mpg))
g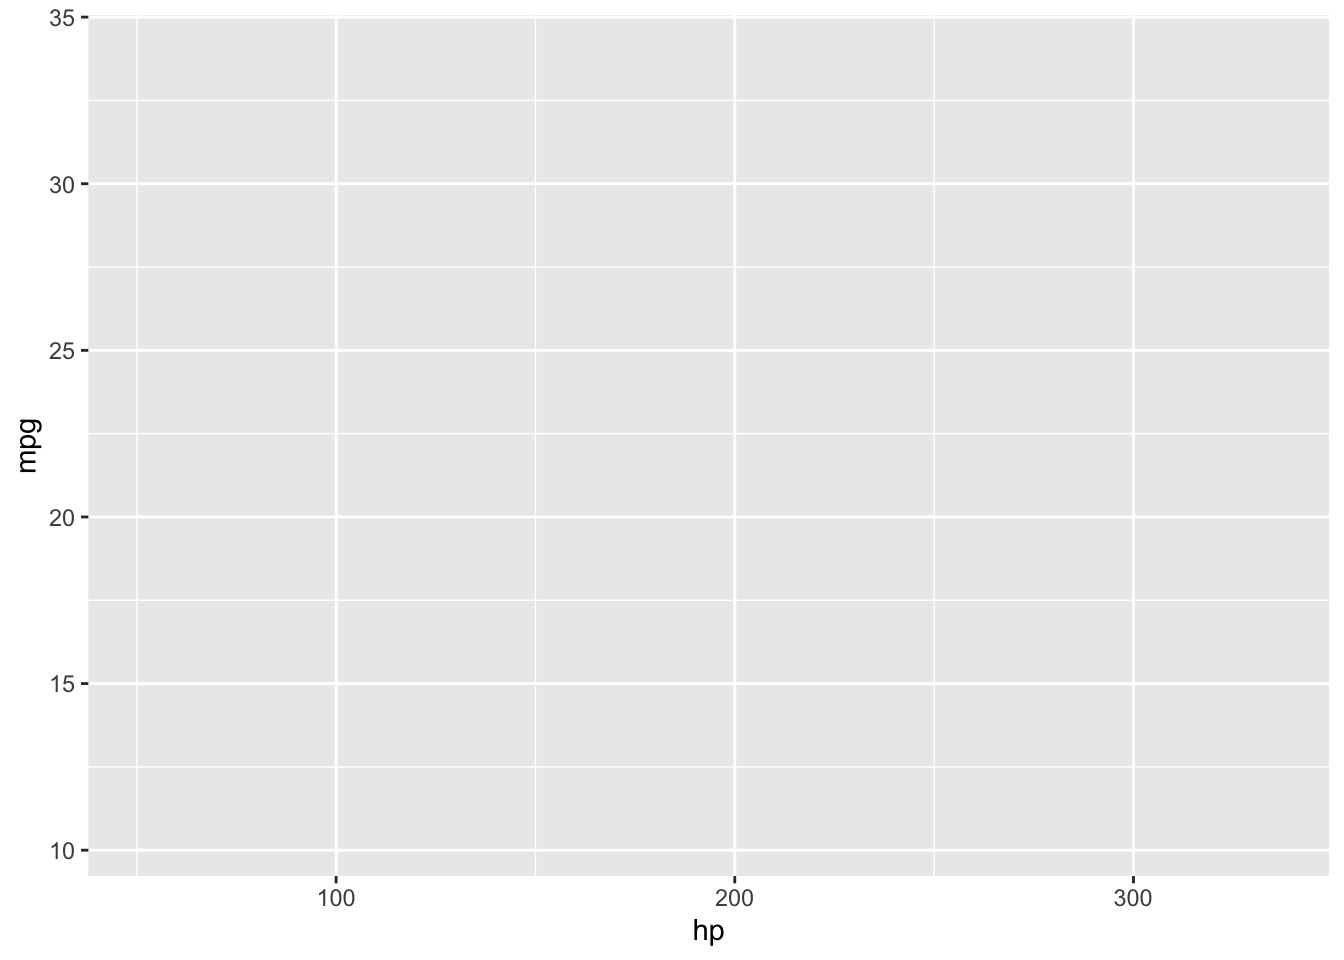
# Add bar, dunno why its always stat="identity"
g <- g + geom_bar( stat="identity" )
g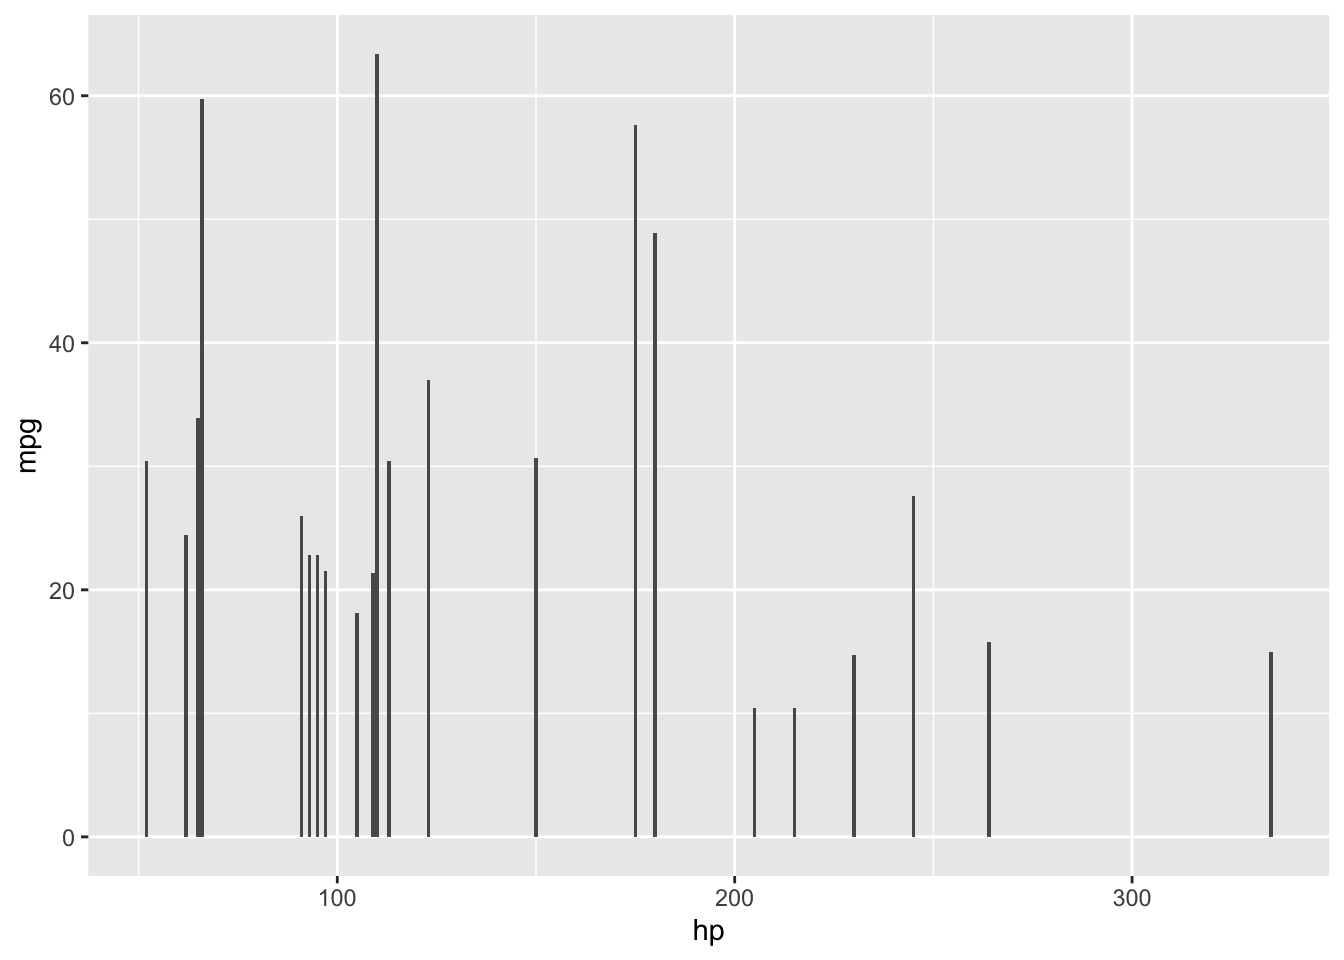
# Add scale for y-axel and limits
g <- g + scale_y_continuous(limits = c(0, 100) )
g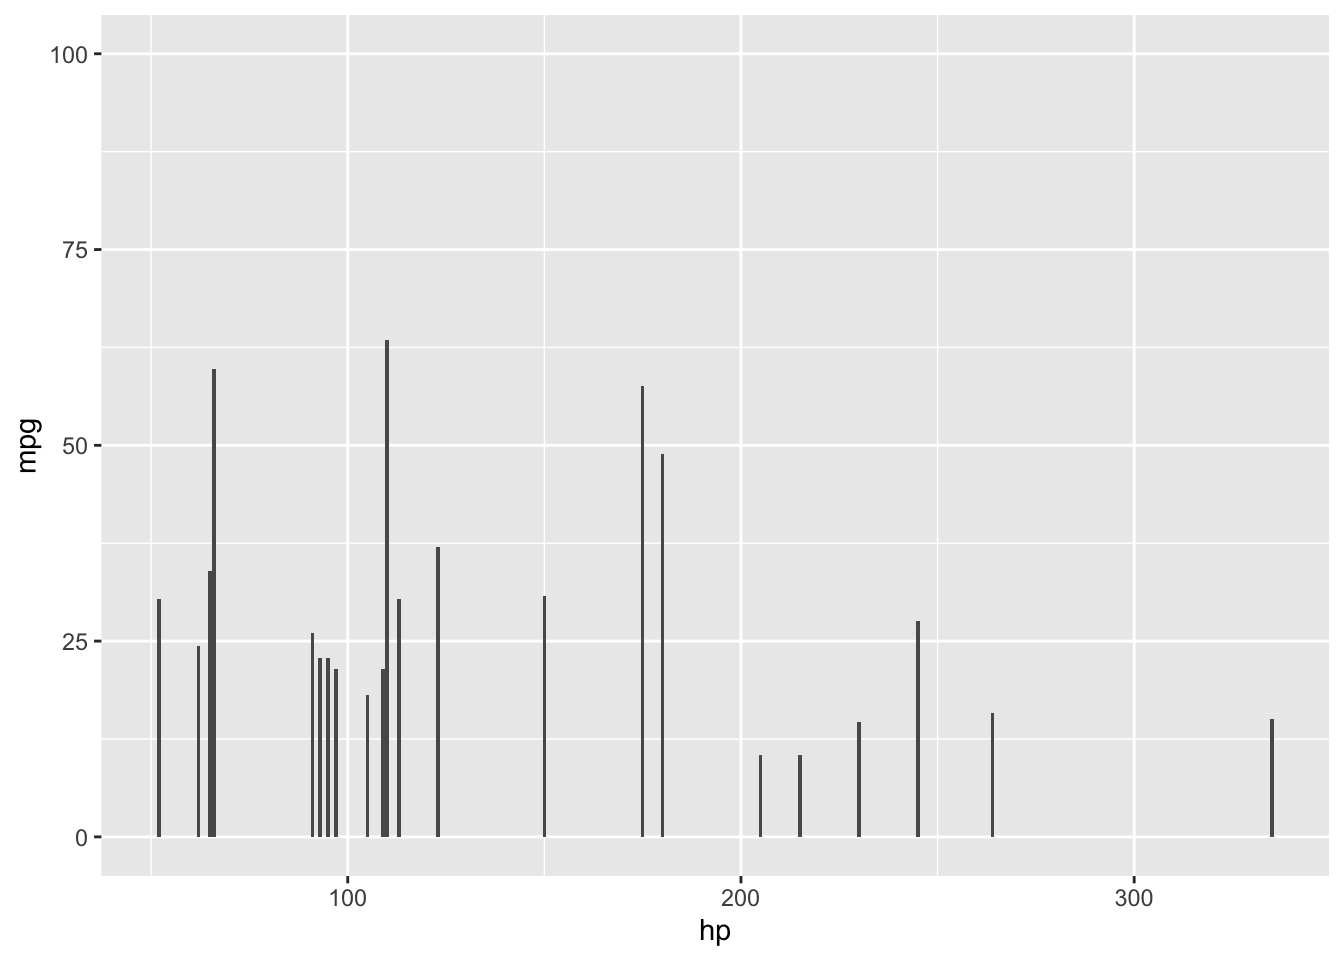
# Add text on top of bar
g <- g + geom_text(aes(label=paste0(mpg, " heeeoo!")))
g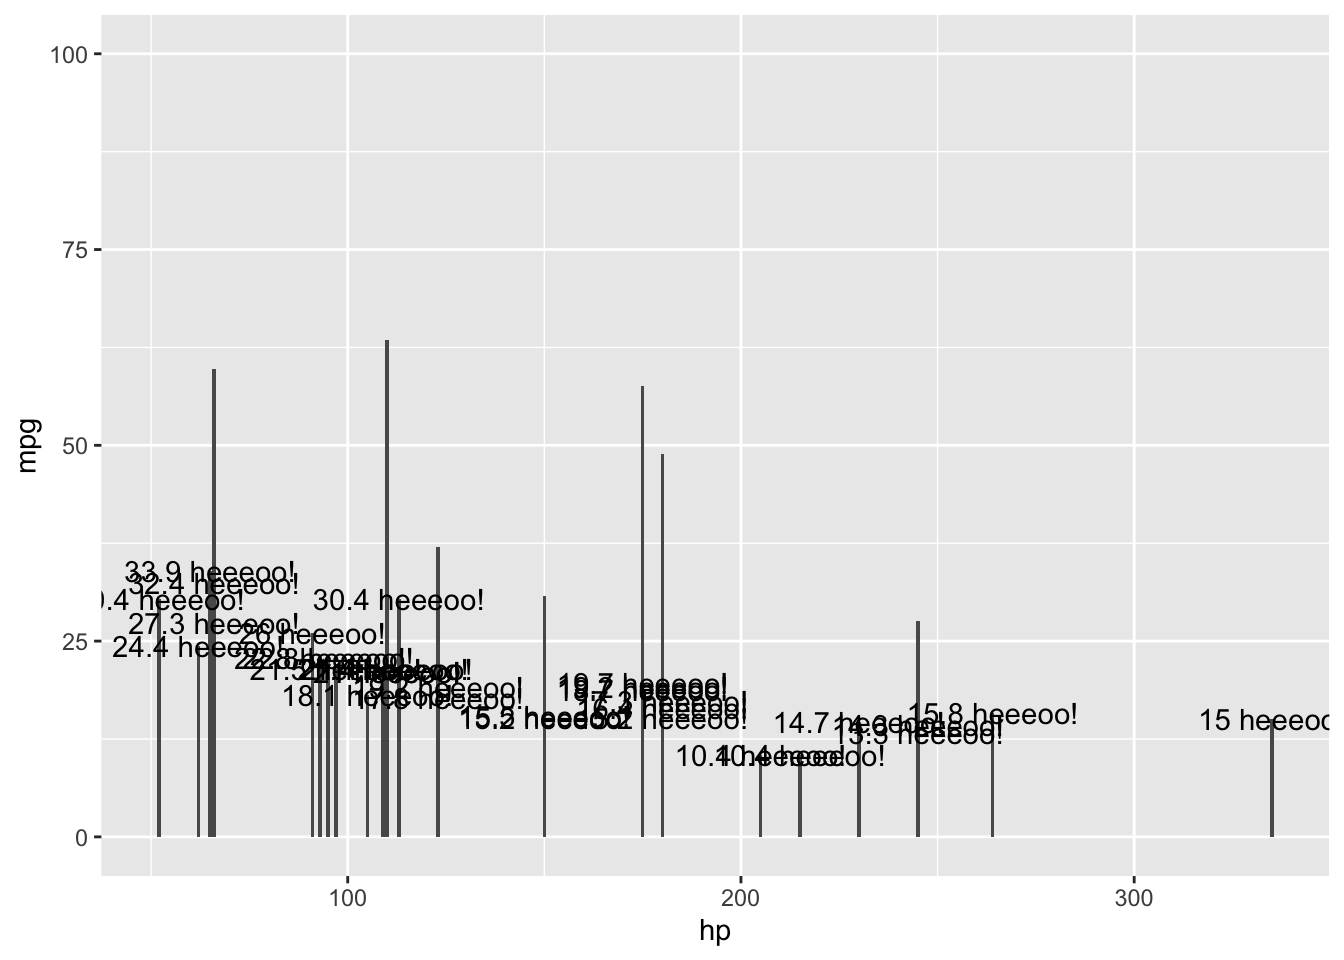
# Theme, legend direction and position
g <- g + theme(legend.position="top", legend.direction="horizontal")
g
# Remove legend
g <- g + theme(legend.position="none")
g
How to assign fixed COLOR to GROUP in ggplot
# Random dataset (this isn?t 'good' data for barplot plot, but you get the idea)
dat <- data.frame(x=runif(10),y=runif(10), grp = rep(LETTERS[1:5],each = 2),stringsAsFactors = TRUE)

# Determine colors. Here I use package RColorBrewer to give ready patterns:
library(RColorBrewer)
myColors <- brewer.pal(5,"Set1")
names(myColors) <- levels(dat$grp)

### In point graph use 'scale_colour_manual'
# First plot of whole data
ggplot(dat, aes(x, y, color = grp, fill = grp)) +
  geom_point() +
  scale_colour_manual(values = myColors)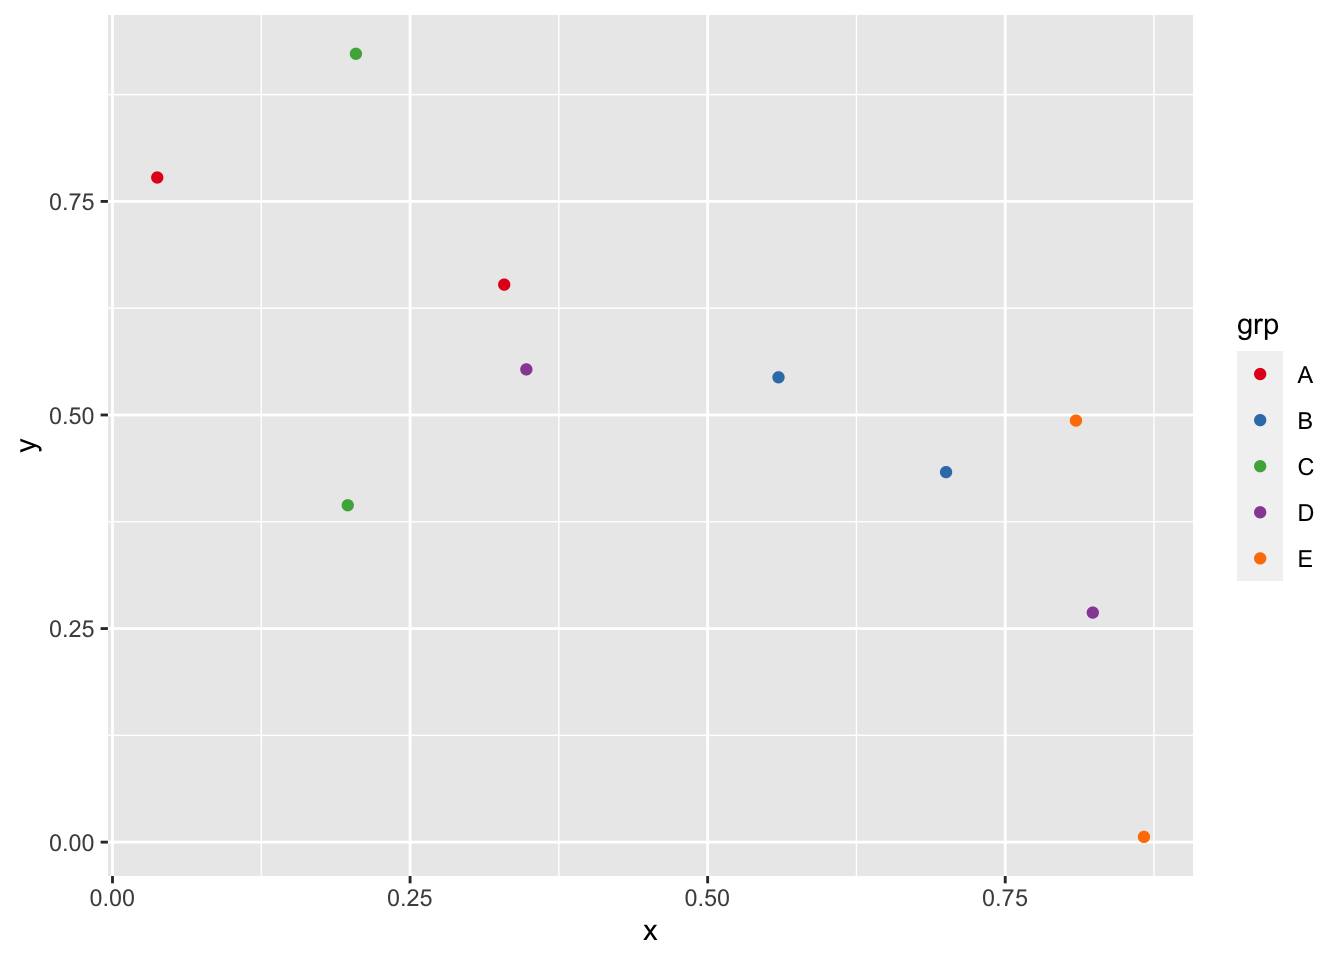
# A second plot with only four of the levels
p <- ggplot(dat,aes(x,y,color = grp, fill = grp)) + geom_point()
p2 <- p %+% droplevels(subset(dat[4:10,])) + scale_colour_manual(values = myColors)
p2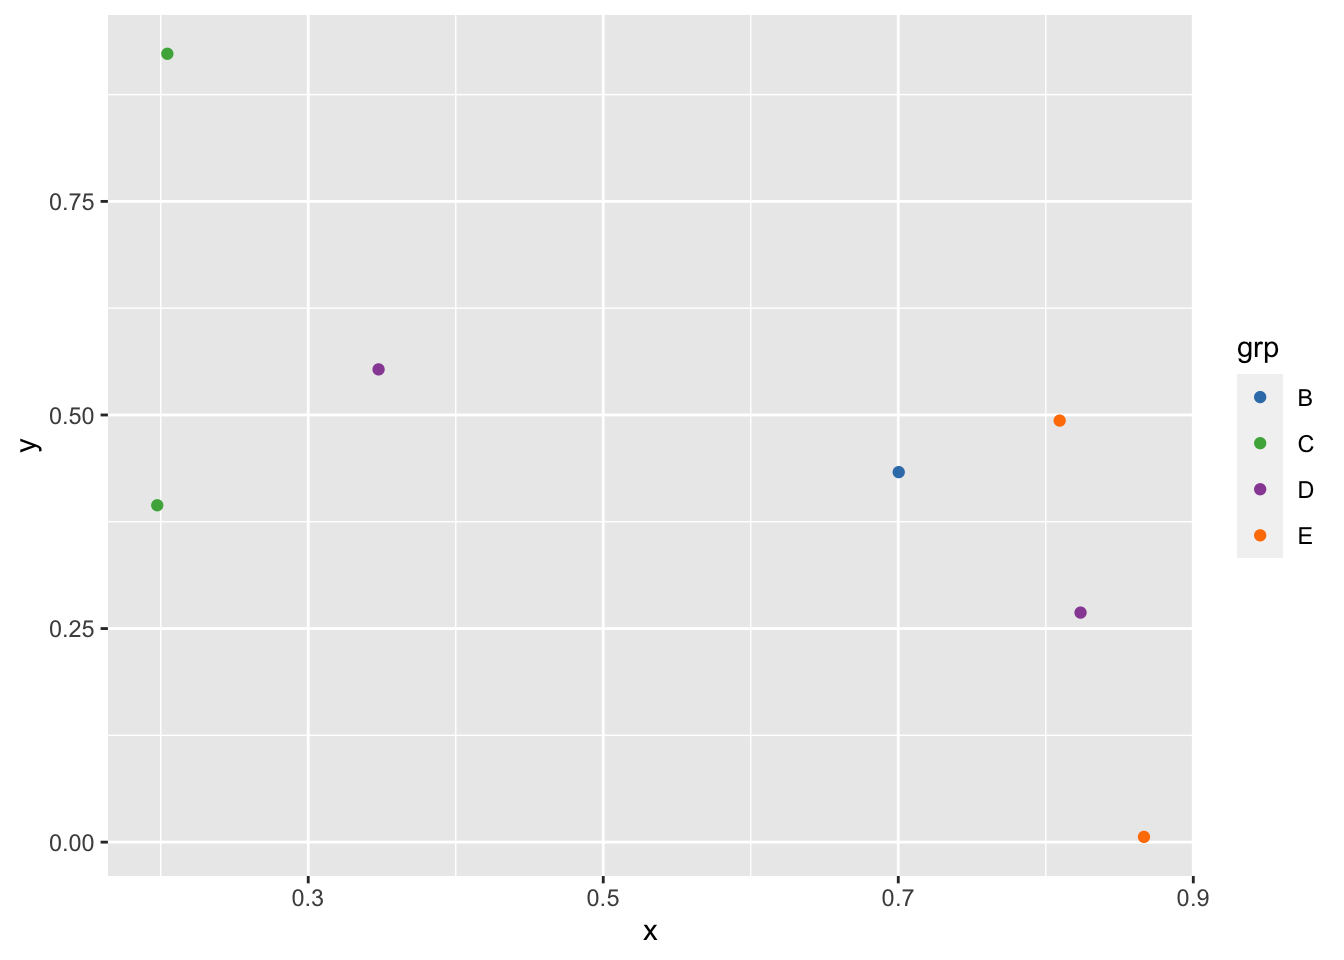
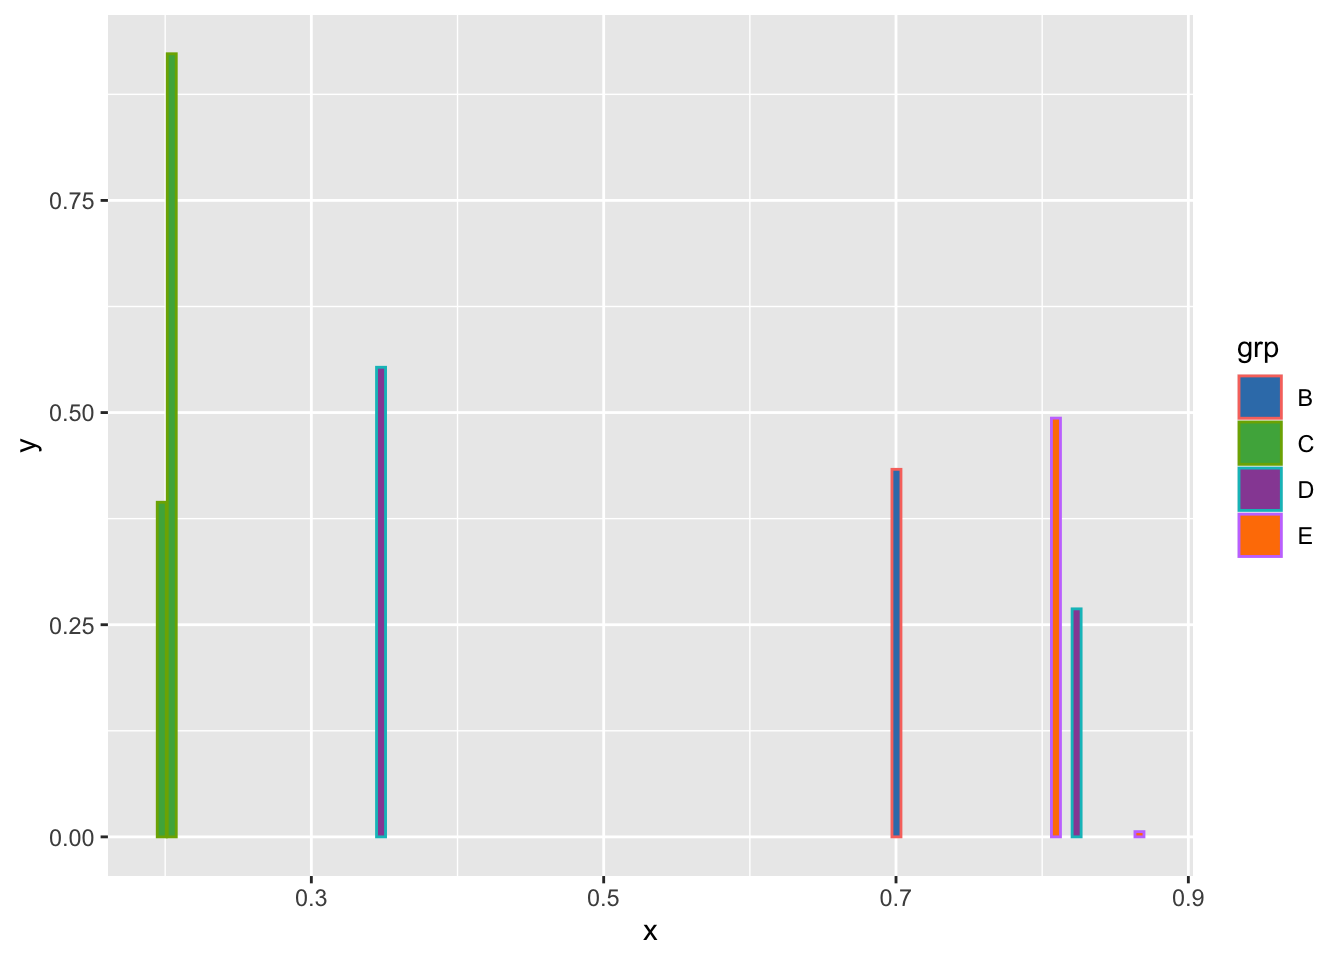
### In barplot graph use 'scale_fill_manual'
ggplot(dat,aes(x,y, color = grp, fill = grp)) +
  geom_bar(stat = "identity") +
  scale_fill_manual(values = myColors)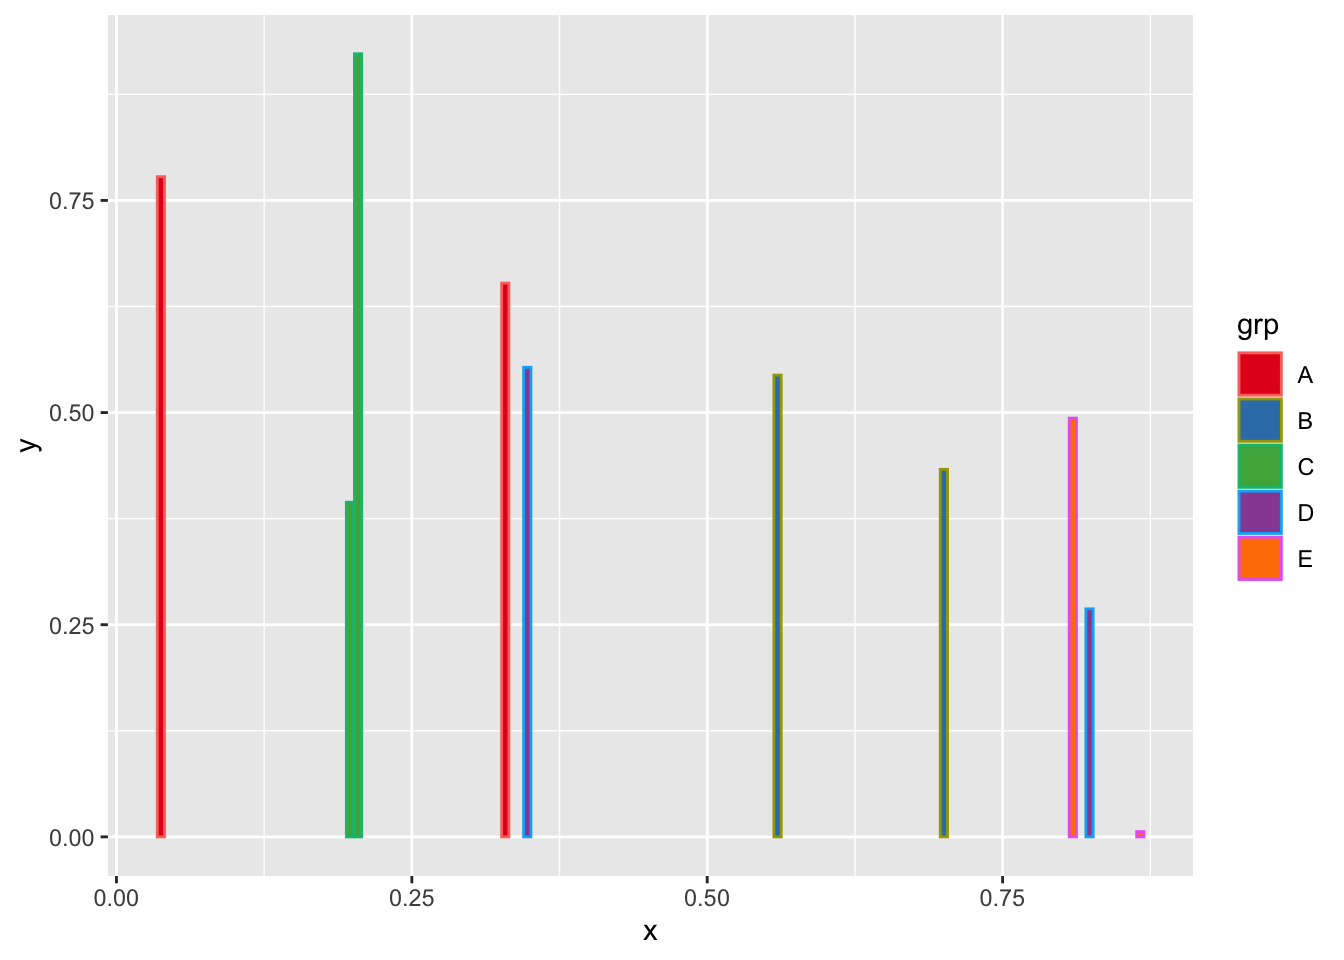
#A second plot with only four of the levels
p <- ggplot(dat,aes(x,y,color = grp, fill = grp)) + geom_bar(stat = "identity")
p2 <- p %+% droplevels(subset(dat[4:10,])) + scale_fill_manual(values = myColors)
p2